PURPOSE
- Control over the analyzer and spectrum accumulation parameters
- Energy and half-width calibration
- Search for peaks and calculation of peak areas
- User’s graphical interface employing windows, a menu, and a mouse
DESCRIPTION
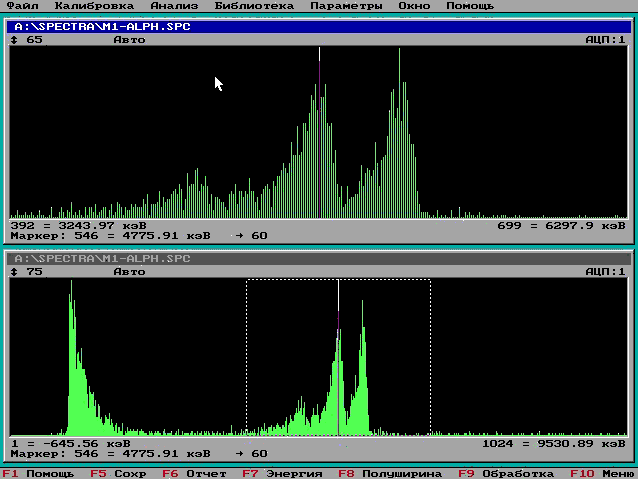
The program carries out a fast qualitative and quantitative analysis of gamma spectra in a user-convenient interactive mode with communication through the menu and windows.
Both the keyboard and the mouse can be used for the work.
The spectrum to process can be read from the ADC or disc. A wide set of scaling functions is available for viewing the spectrum. Information on the sample parameters can be
stored for each spectrum; this information will be saved together with the spectrum as the latter is recorded to the disc.
The program includes procedures for calibration of the system. The energy and half-width calibrations are approximated by polynomials up to degree 3. The calibration points can
be specified manually, by the marker’s position, or (for half-width calibration) automatically from the latest result of the spectrum analysis. A special feature of the program is its ability to carry
out calibration on the basis of a few different spectra, the calibration points derived from each previous spectrum being saved and used in the calculation together with new ones.
The quality of the calibration can be visually assessed from the plotted curve.
The automatic peak search algorithm finds peaks whose statistical significance exceeds the threshold set by the user. The user can mark or remove peaks manually.
Based on the results of the analysis the program generates a report, which includes a table of the peaks found. The form of the report is specified by the user. The report can be displayed, printed,
or stored as a file. It is also possible to print a plot of the spectrum with identifications of the peaks found.
The program requires MS-DOS, 640 KB RAM, a floppy or hard disc drive, a VGA graphical adapter.
|